How to Use AI to Organise Your Shared Inbox
A practical walkthrough that illustrates how to turn thousands of unstructured emails into data map with hierarchical topics.

Why most team miss the signal
Every day, organizations process massive volumes of unstructured text - customer emails, help‑desk tickets, internal documents, chat logs, feedback forms, policy notices, and more. It is not just the quantity, but also the diversity and noisiness that makes this data hard to manage.
Teams organize unstructured data using tags, buckets, spaces, etc. However, by doing this they still do not get a high‑resolution view - what's spiking this week, which themes are growing, and what to fix first.
Why most teams miss what matters? The reality is that static categories and scattered dashboards hide the signal. What leaders actually need is a living picture of which problems are growing now, what is driving them, and how to respond consistently.
Example of some buckets in which customer requests get classified Billing & Payments, Technical Support, Service Outages, etc. These buckets are coarse and often lag real customer sentiment. Teams typically only see counts by static categories, lacking deeper insight into cluster-level patterns or theme-level changes over time. Without advanced text analytics capabilities, businesses struggle to identify strengths, improvement areas, and make data-driven decisions from their customer feedback data.
The opportunity is hiding in plain sight: every customer support team already owns a goldmine - thousands of past tickets and the responses that resolved them. Structured into clusters and themes, this "corporate memory" finally gives operators and management a real-time view of their operation at scale. Just as importantly, it provides the foundation for LLM-based agents - like the ones we are building at Interloom that can handle new issues more effectively.
In this post, we will show a short walkthrough on a public dataset, explain the approach in plain language, and share the metrics that prove it's working.
A quick, real‑world walkthrough (using a public dataset)
In today's reality, most support teams handle tickets reactively. A human agent receives a customer's message, tries to craft the best reply on the spot, and moves on. The problem? There's no easy way to know if a colleague just solved the same issue twenty minutes ago - or if it is a new type of problem that should be documented and shared. Valuable knowledge gets buried inside individual inboxes and chat threads.
To reduce chaos, companies often introduce manual categories (e.g. "Technical Support," "Product Support") to at least count and route tickets. While helpful, this approach has serious limitations: categories are static and too broad, they rarely capture the root causes or emerging patterns, teams still spend time reinventing answers instead of reusing knowledge.
The result is a workflow that feels like firefighting: every problem is solved ad-hoc, without the benefit of collective memory or a high-level overview of what is really happening.
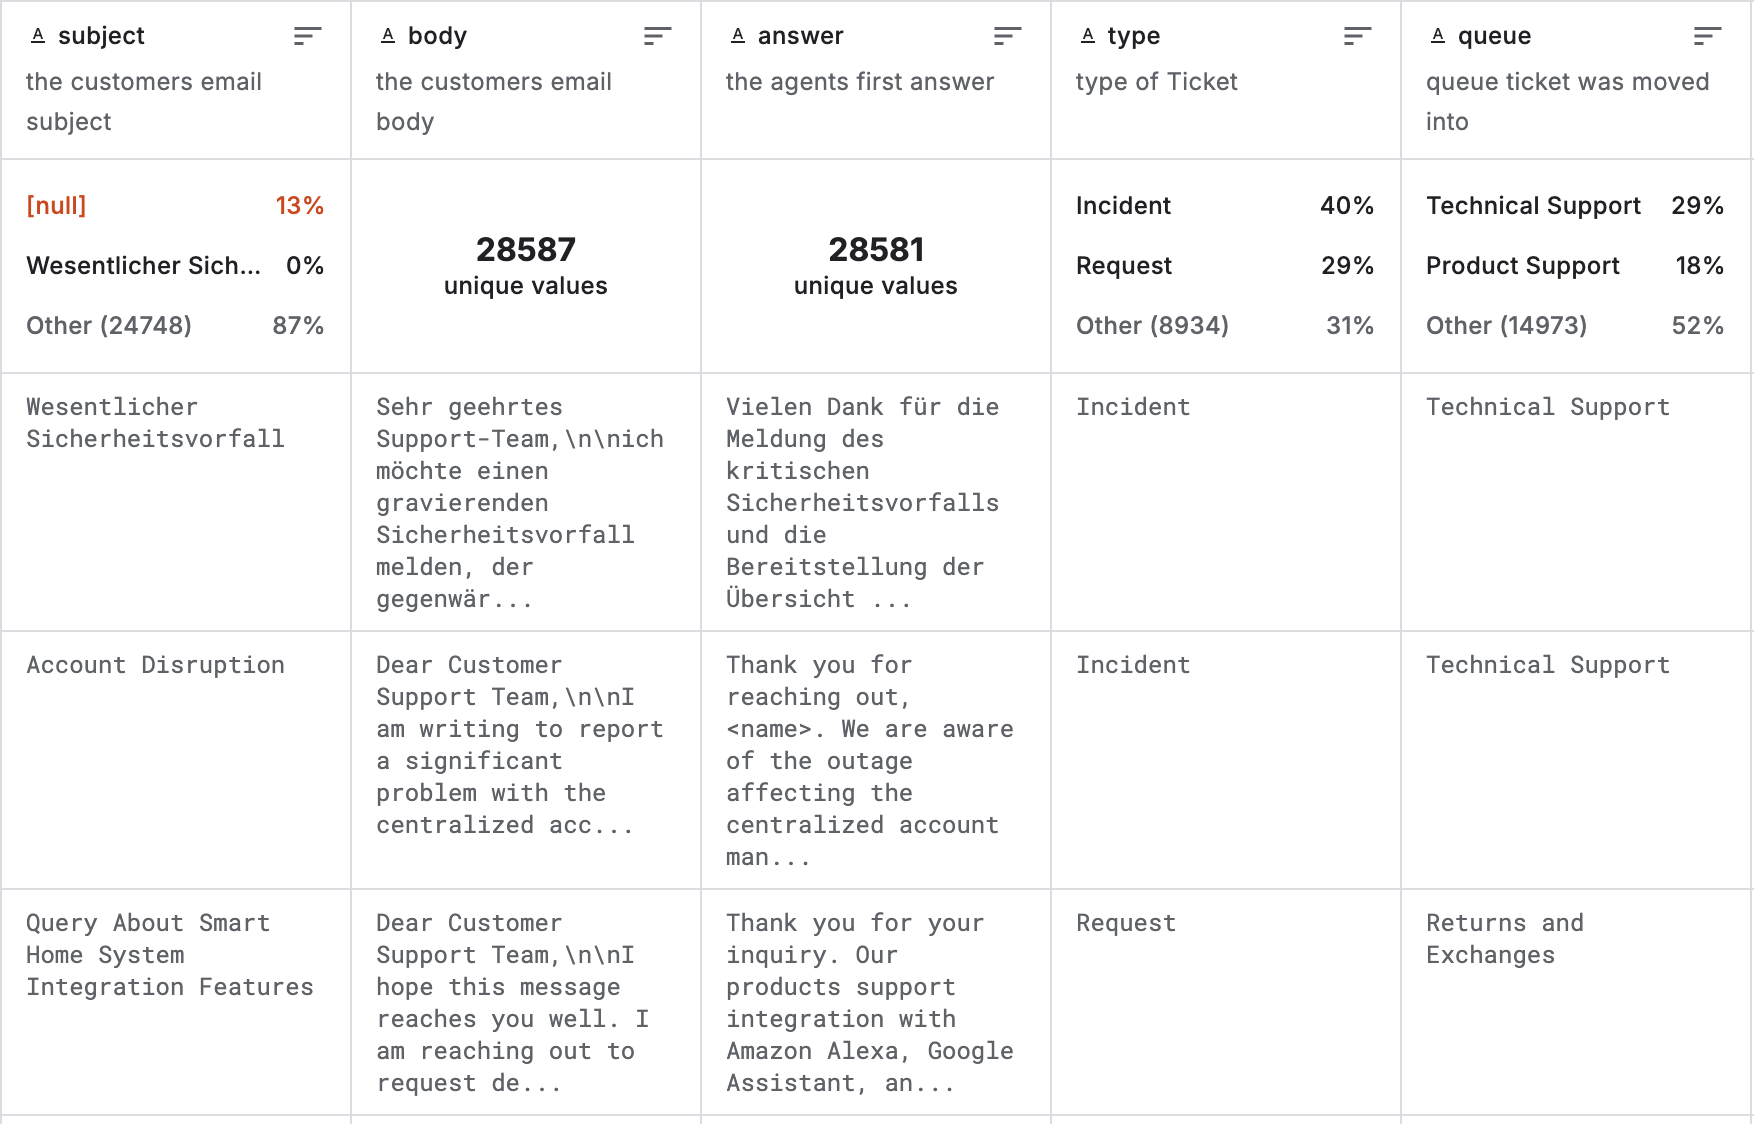
Let's explore a practical example leveraging a Customer IT Support - Ticket Dataset. The dataset contains around 30,000 real customer support exchanges, where each record captures an email from a customer along with the company's first reply.
Let's turn it into actionable view and analyze top-level problems first.
Identifying Critical Problem Clusters
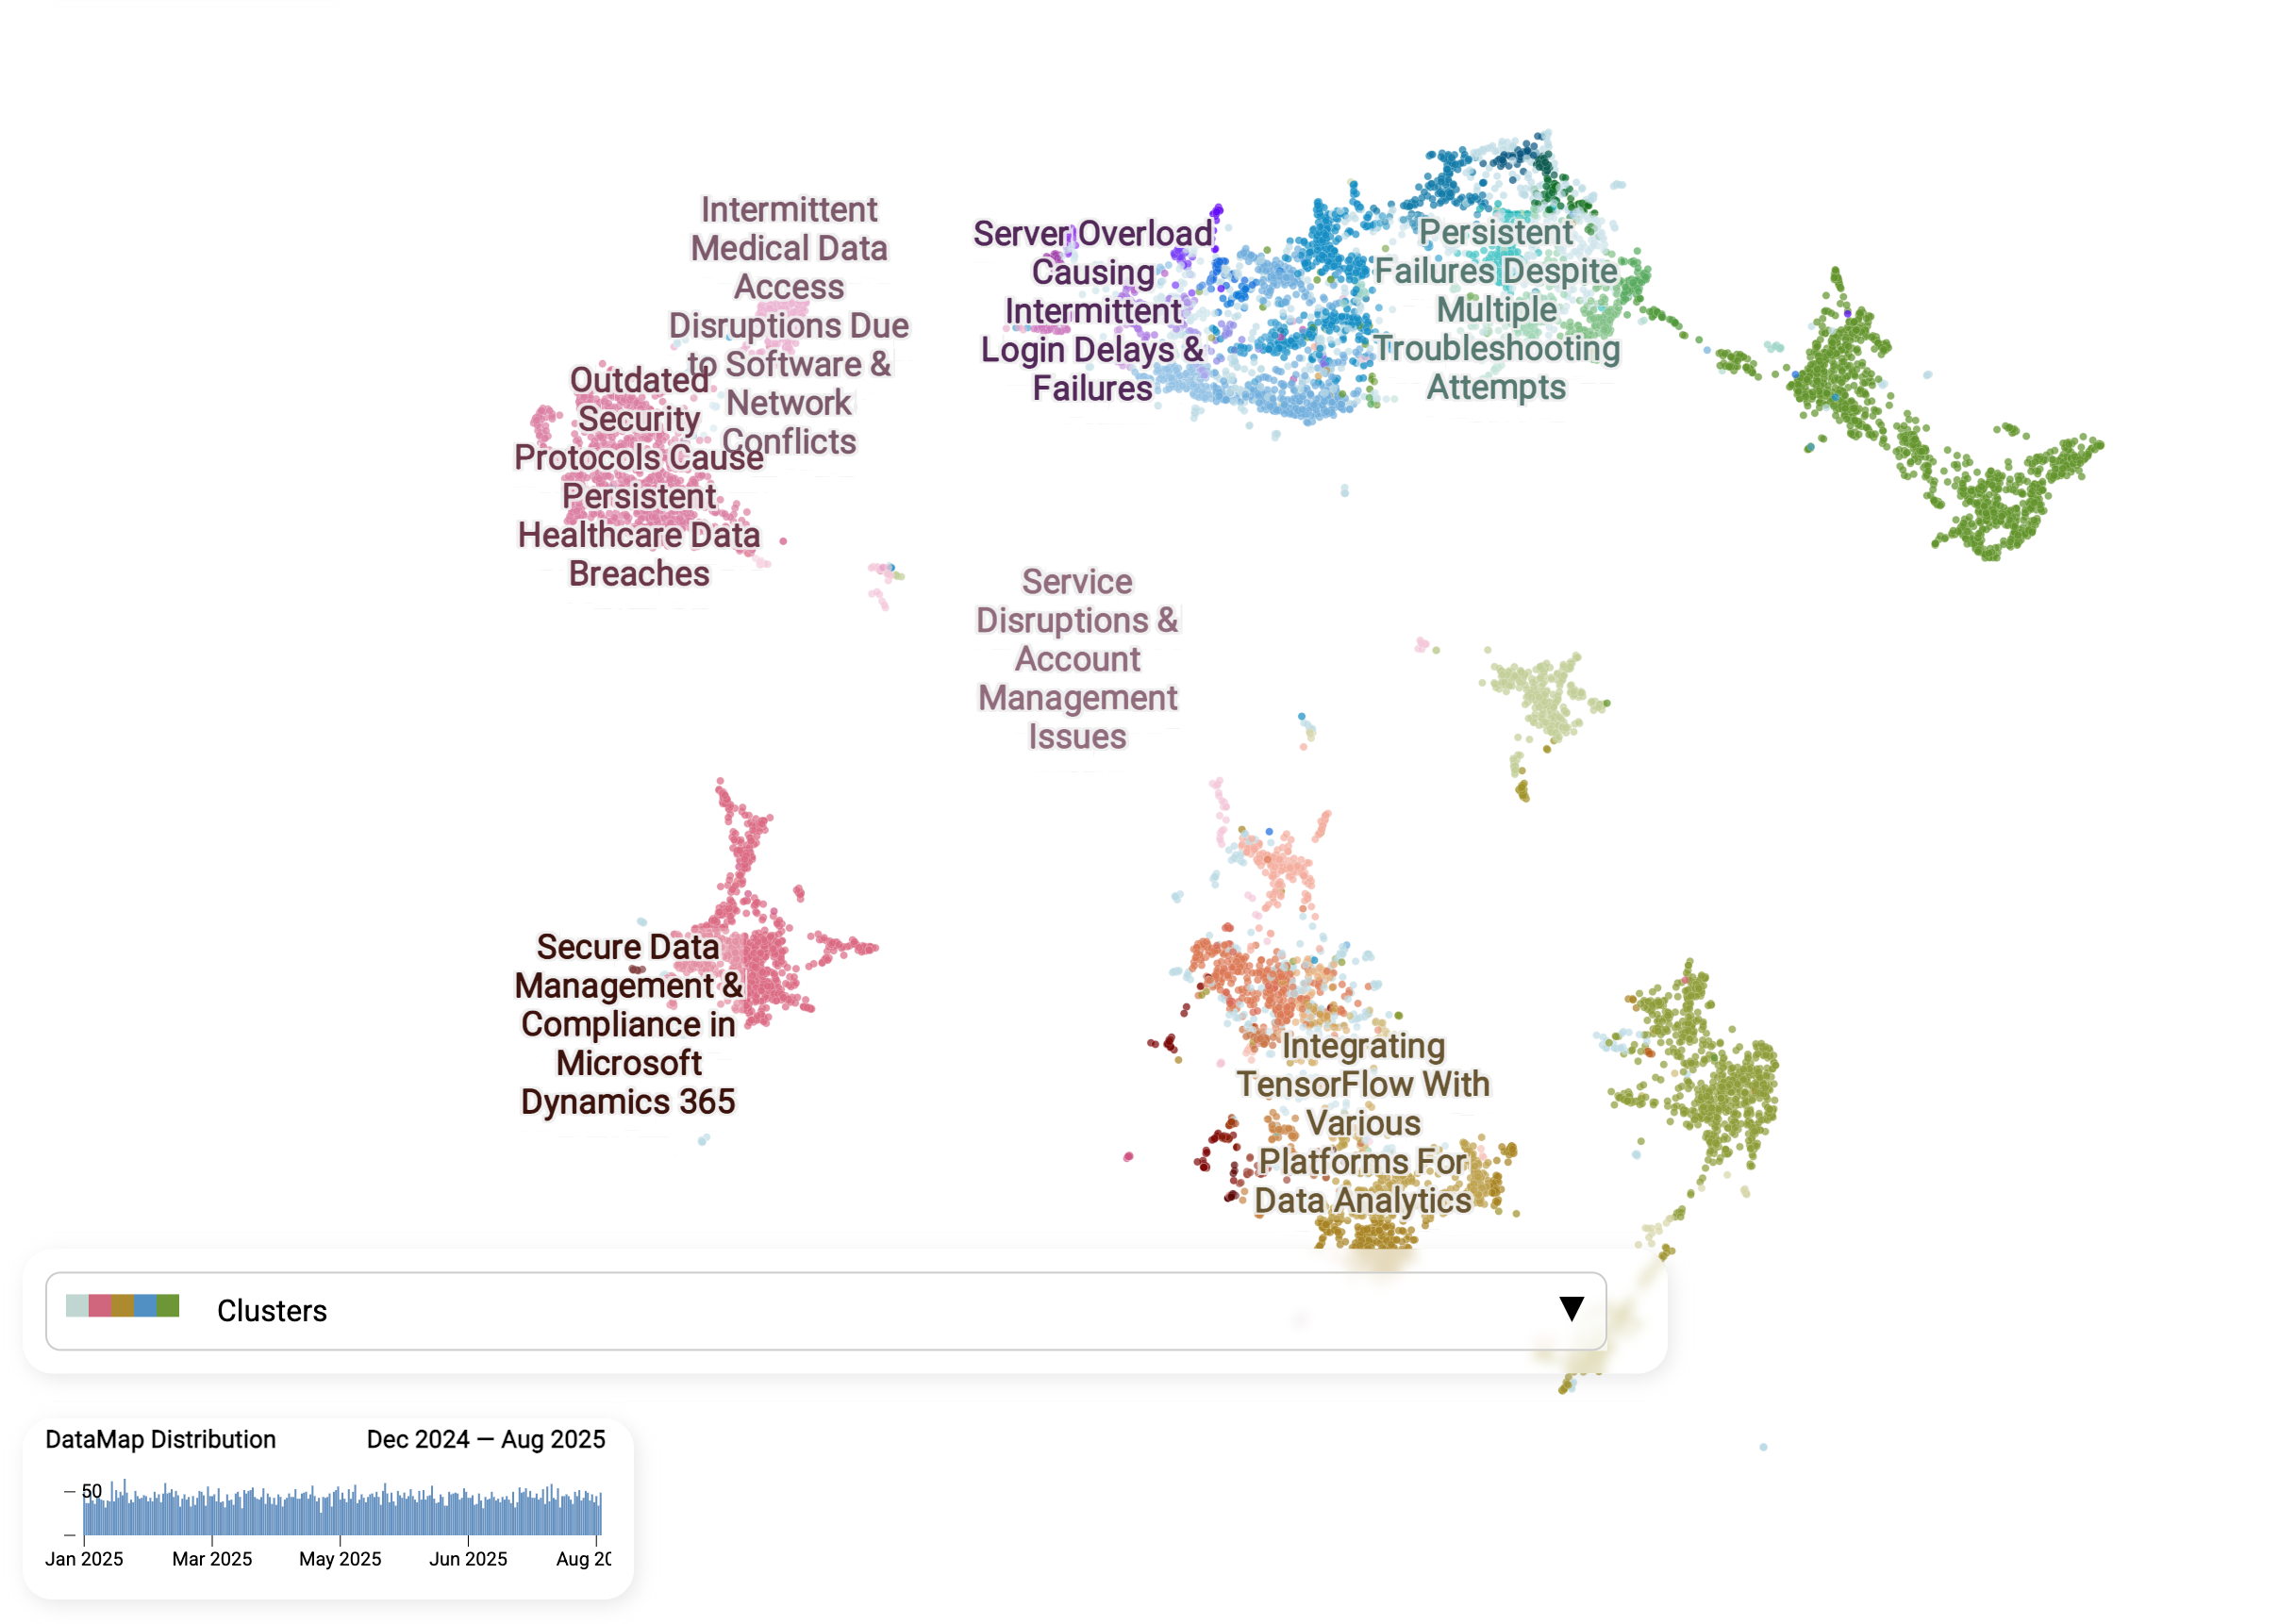
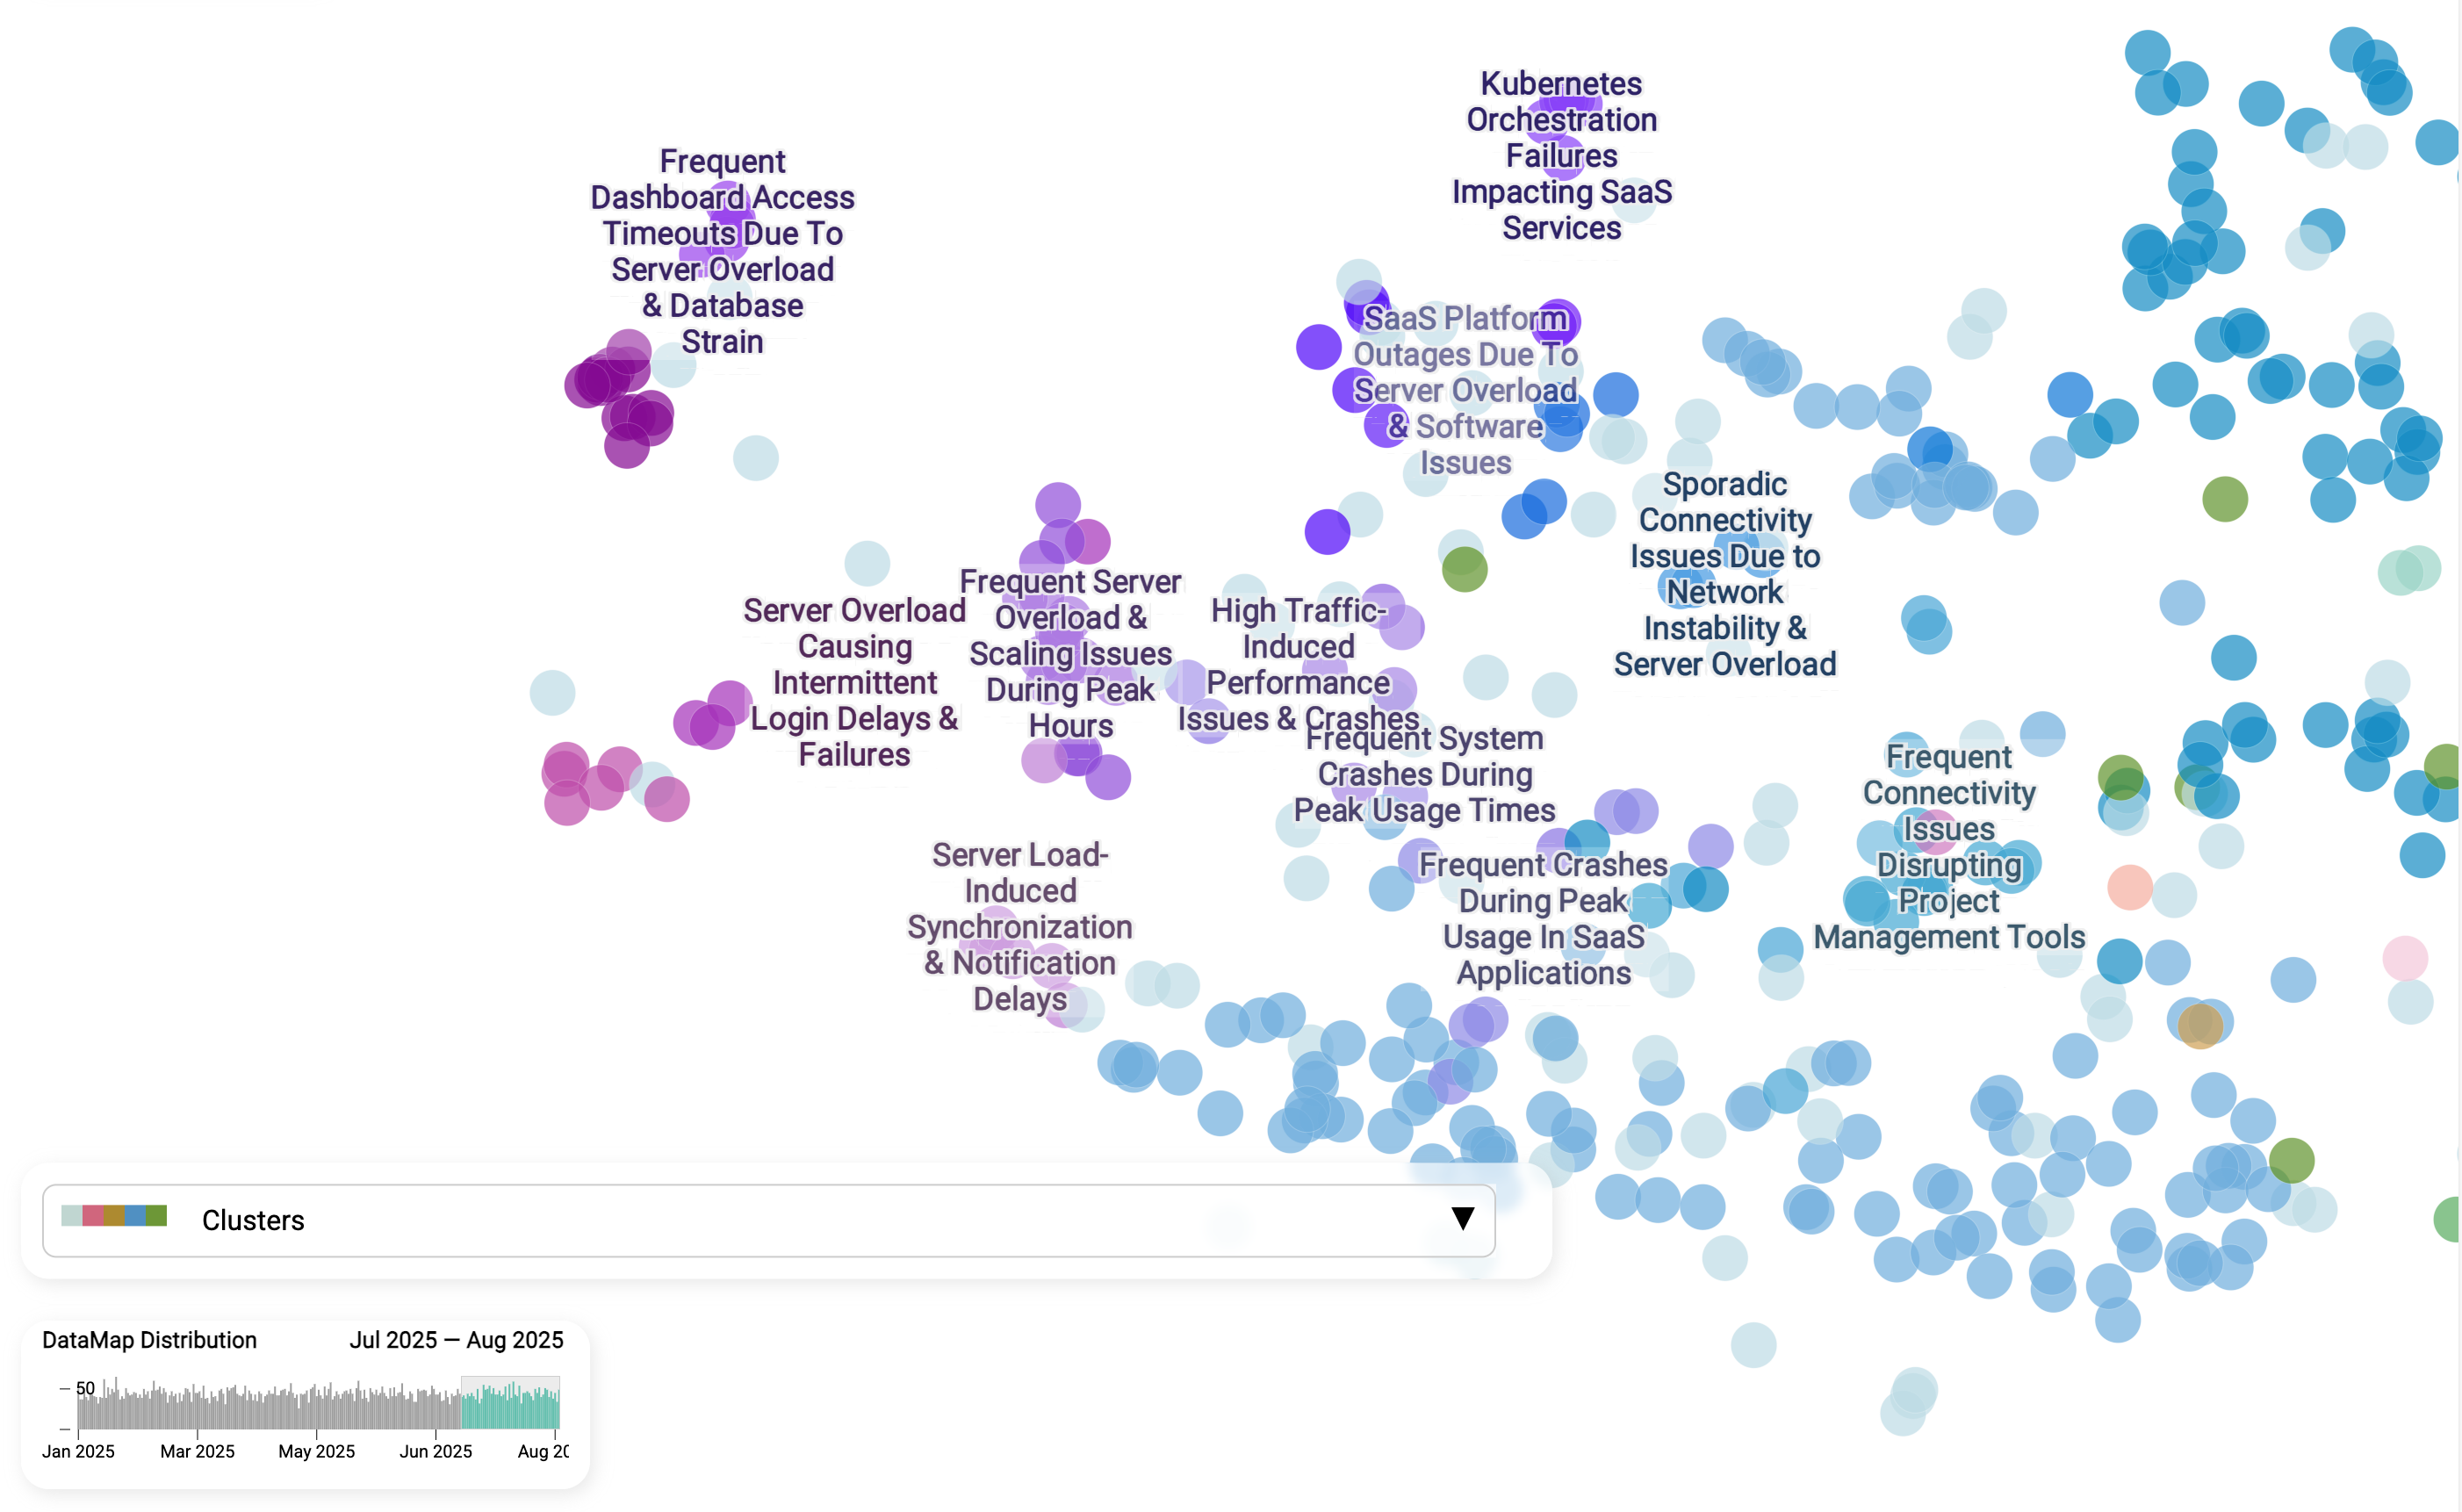
This map is a visual snapshot of dataset about, each dot representing a single conversation between a customer and the support team. This is not a traditional scatter plot or a bar chart where categories are defined in advance. Instead, the AI discovers categories automatically by reading every ticket, comparing their meaning, and letting similar issues "find" each other.
- Dots close together mean similar issues. By turning each message into a "meaning vector," the AI can recognize when different customers are describing the same kind of problem -even if they use different words or languages.
- Clusters emerge naturally. Unlike static ticket categories ("Technical Support," "Product Support"), these groups are not predefined. They form based on the actual language customers use, so patterns surface that might otherwise stay hidden. You can see how tickets group into distinct islands, such as "Server overload causing login delays", "Persistent failures despite troubleshooting", or "Secure data management in Microsoft Dynamics 365." These are issues that would be buried under static, catch-all categories in a traditional system.
- AI-generated labels. The AI automatically names each cluster so teams can quickly see what the real problems are instead of wading through ticket IDs.
- Trends are trackable. The timeline at the bottom shows when issues spike—allowing teams to spot emerging problems early and act before they spiral.
AI transforms a noisy inbox into an organized map of problems, where teams can zoom in from broad themes to precise sub-issues, and agents can use these insights to provide faster, more consistent responses.
Zoom into one cluster closer: Server overload → intermittent login failures
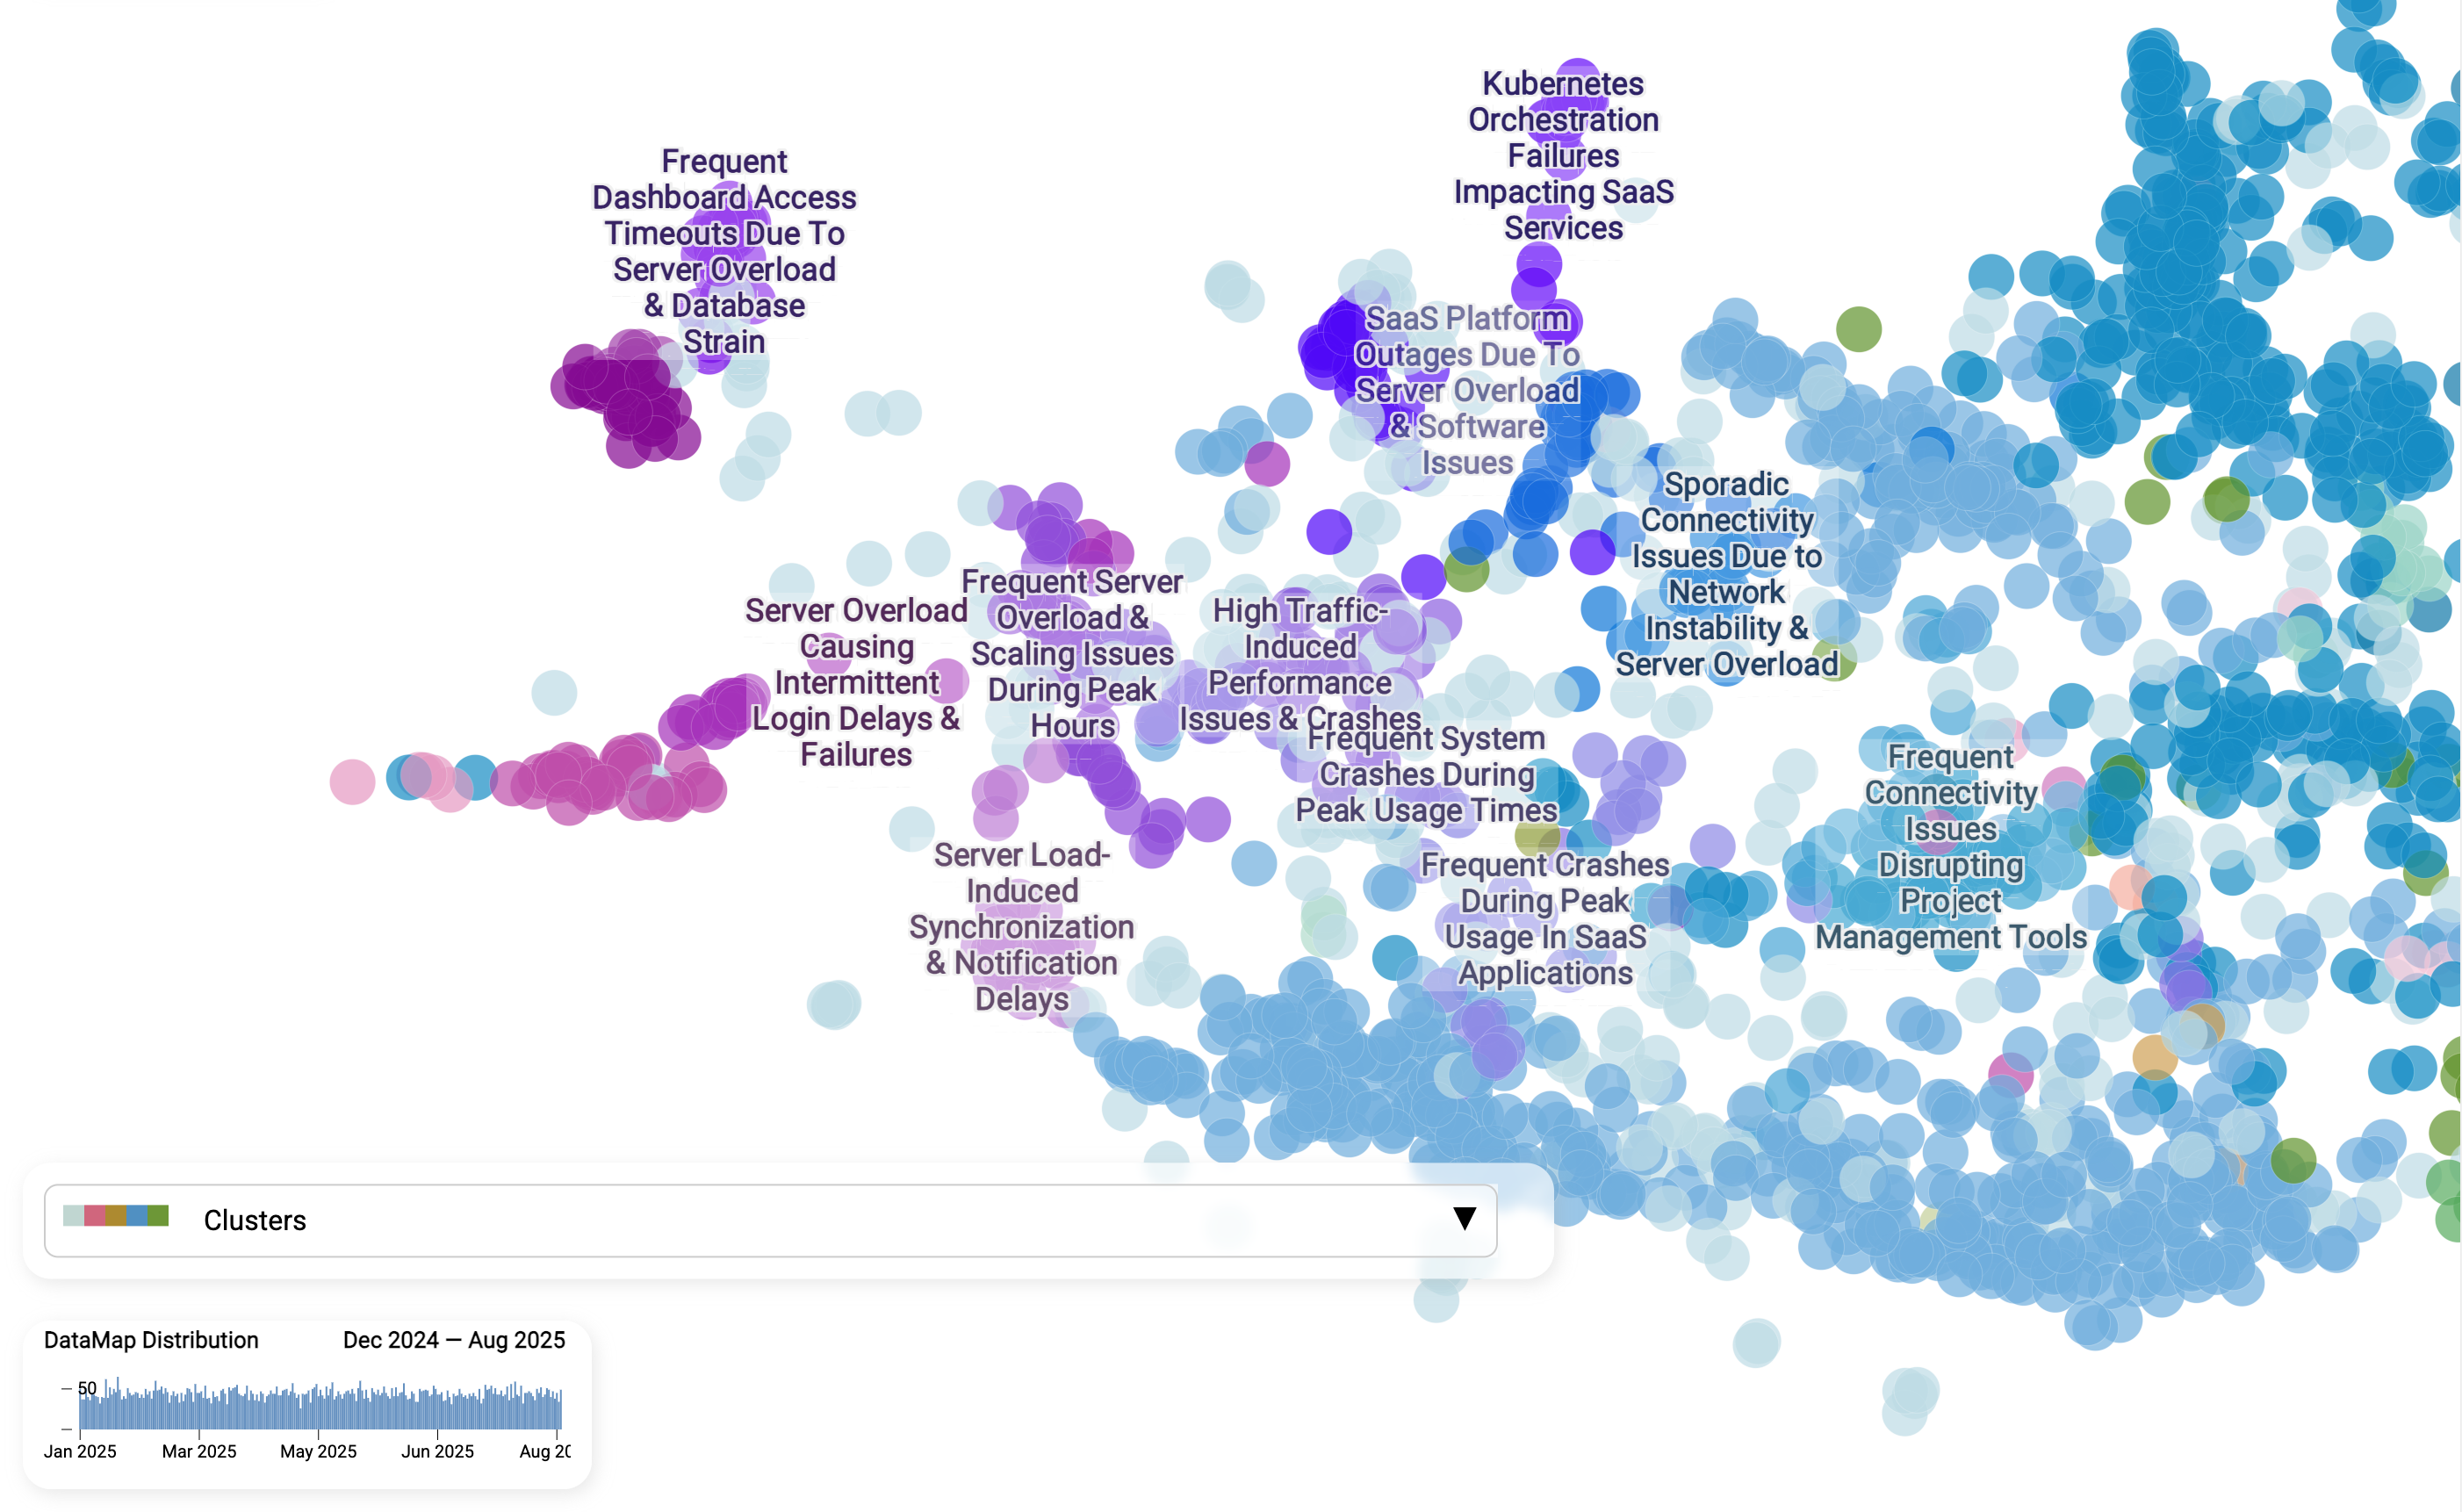
Here we zoom into one specific cluster: "Server overload → intermittent login failures." Each dot is still a single ticket. Customers describe login issues in different ways, but the AI recognizes the shared meaning. Sub-clusters reveal nuance. Within the broader theme, the model detects finer shades of the problem:
- Server overload during peak hours
- Scaling issues causing slow logins
- Notification and synchronization delays linked to load
- Frequent crashes when traffic spikes
Why this matters. Instead of seeing just "Login issues" as one vague bucket, teams get a structured breakdown of the different causes. This makes it easier to assign ownership (e.g., infra vs. software), prioritize fixes, and craft more precise responses.
This zoom view shows how AI does not just group tickets into generic piles, but organizes them into a living hierarchy: broad themes at the top, specific failure modes underneath. That is the high-resolution view static categories can never provide.
Is "Login failures" a new problem or ongoing?
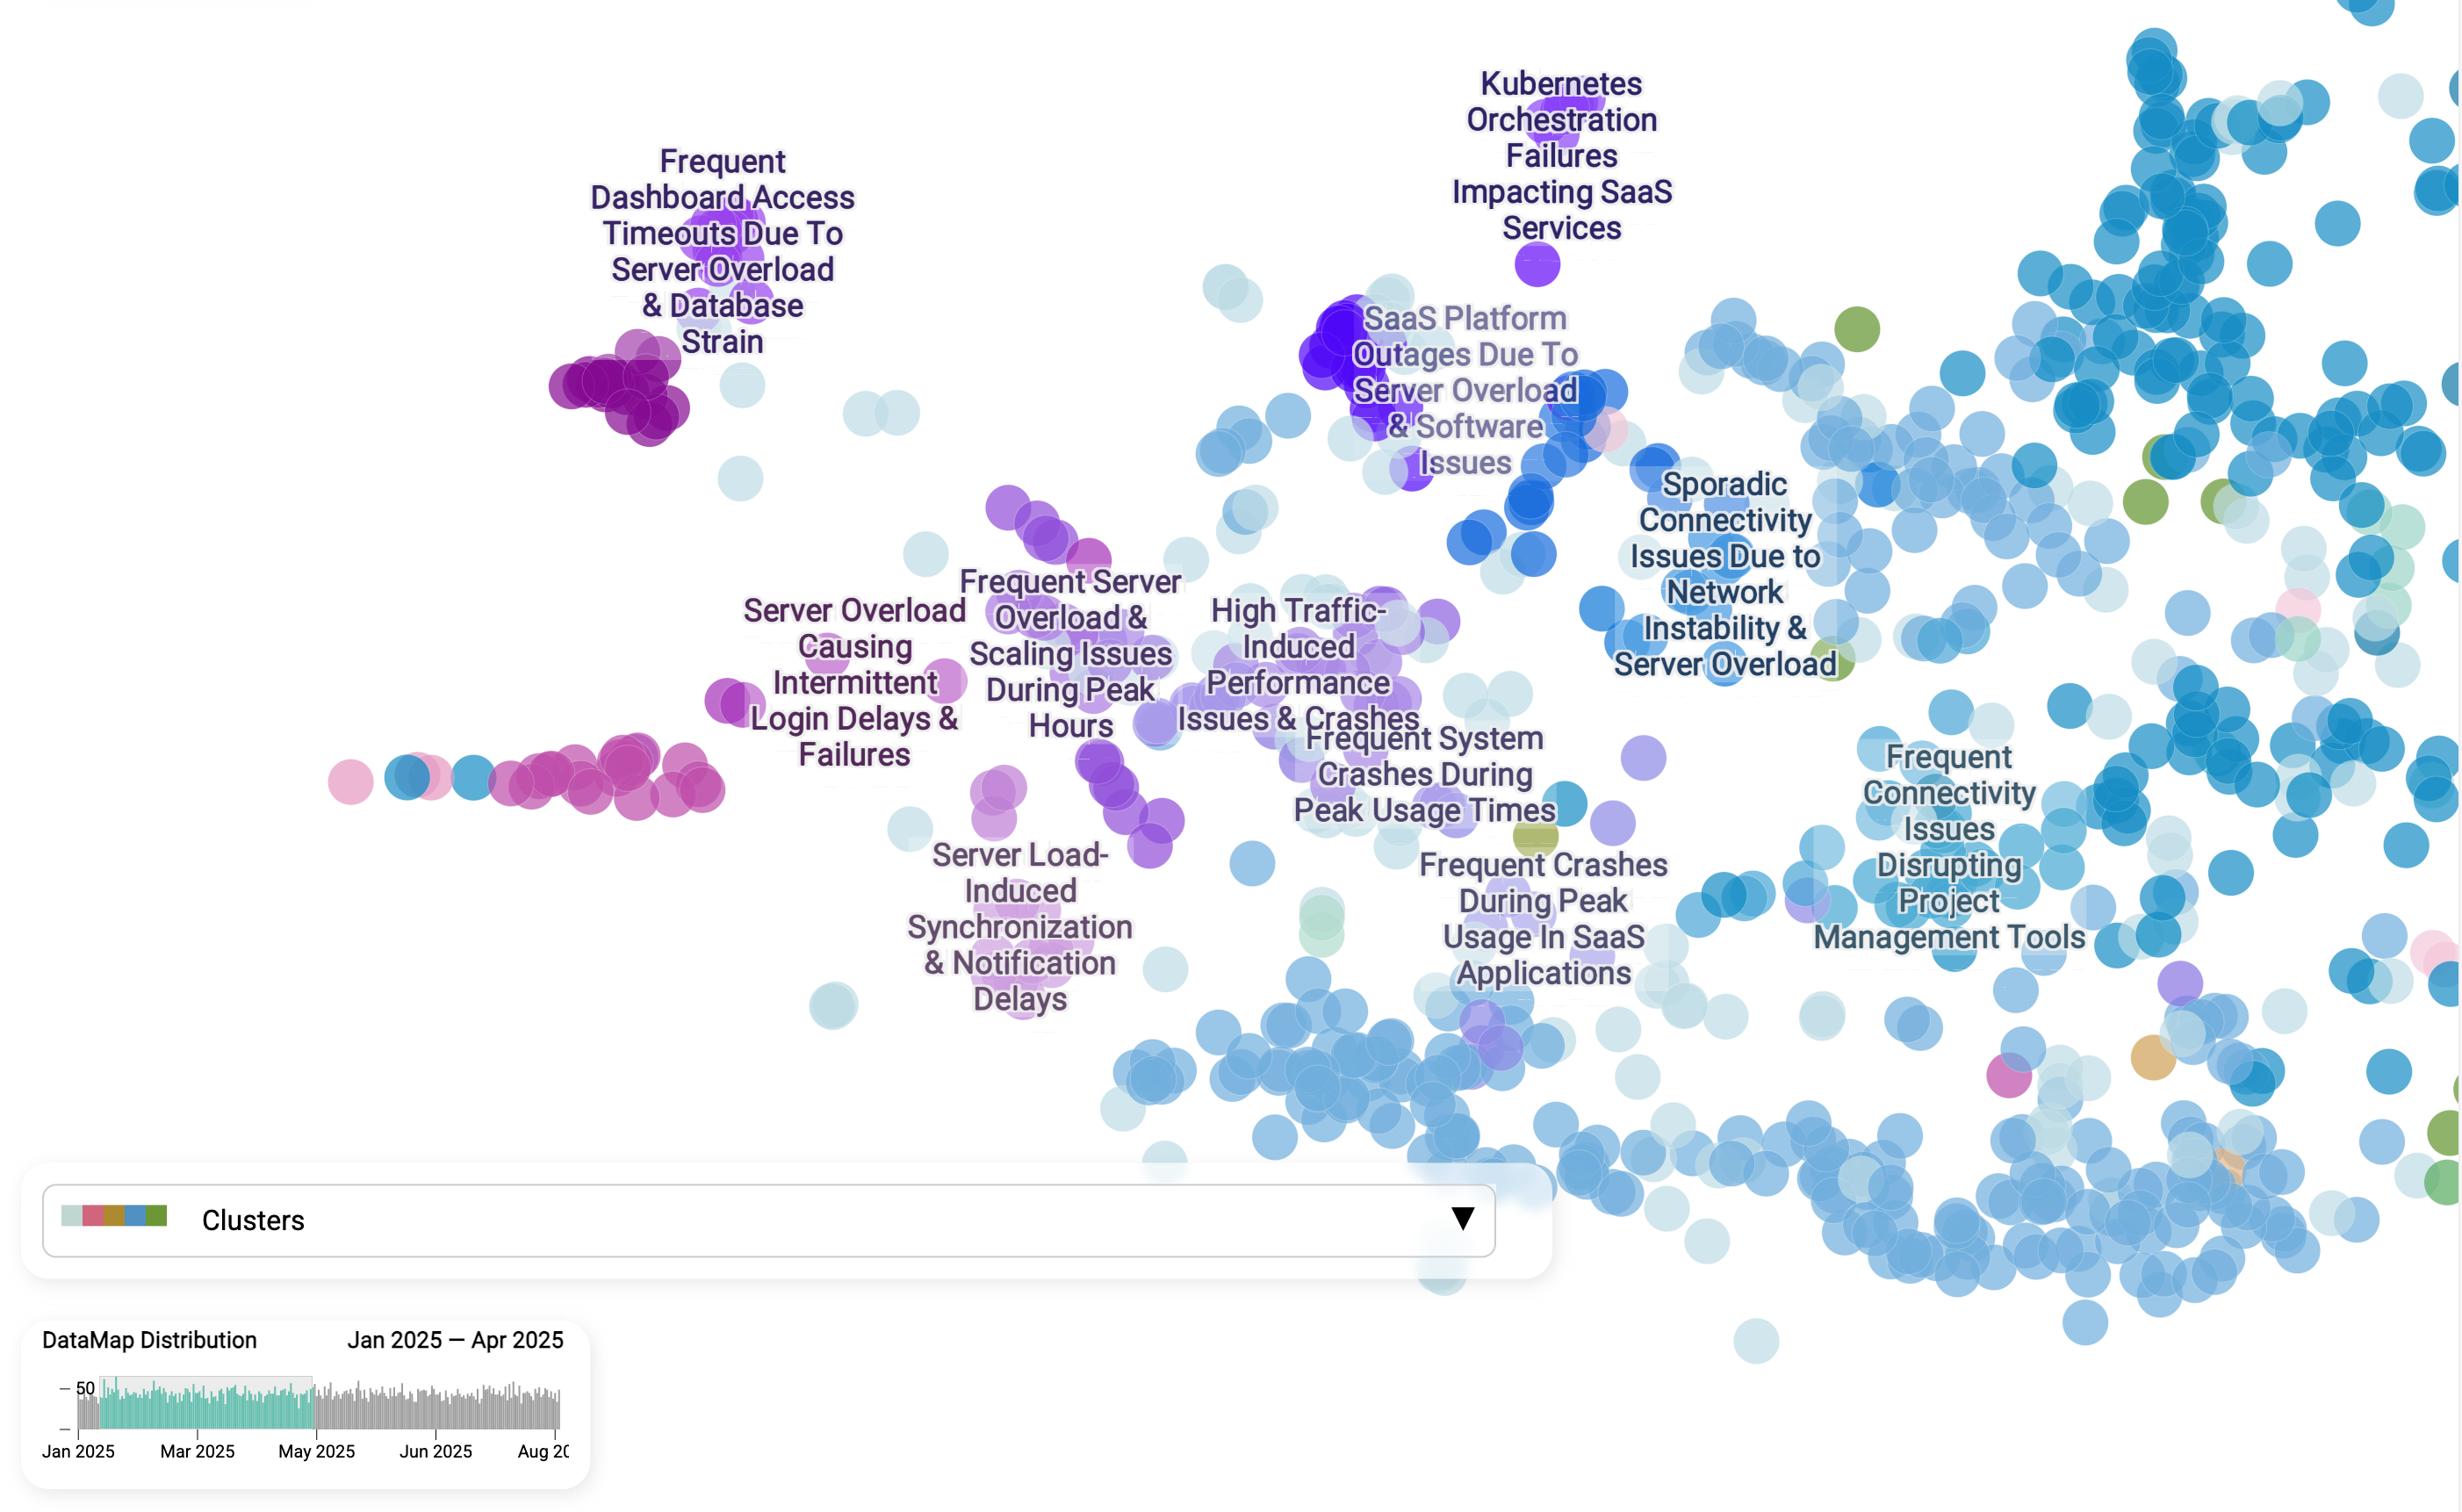
Let's imagine the following story that could happen in every organization: on a Friday after the authentication config release one of team member received multiple emails from customers reporting problems. The team is confused, because they did not expect any problems with new changes. How can we get more insights about if it is just a coincidence or new changes really caused Login problems?
Having a data map that would be aggregating real time cases would reveal this information in seconds. When we compare the Login failures cluster from Jan - Apr with Jul - Aug 2025, the story becomes clear: this is not a one-off glitch but a persistent, unresolved issue. The same sub-themes - server overload, peak-hour scaling problems, and synchronization delays - show up consistently across both timeframes. This kind of view is powerful because it separates chronic pain points from new incidents. Instead of guessing whether a spike in support tickets is tied to a recent release or represents a long-standing weakness, teams can see patterns over time, assign accountability, and invest in structural fixes rather than endless firefighting.
Hear customers in their own words
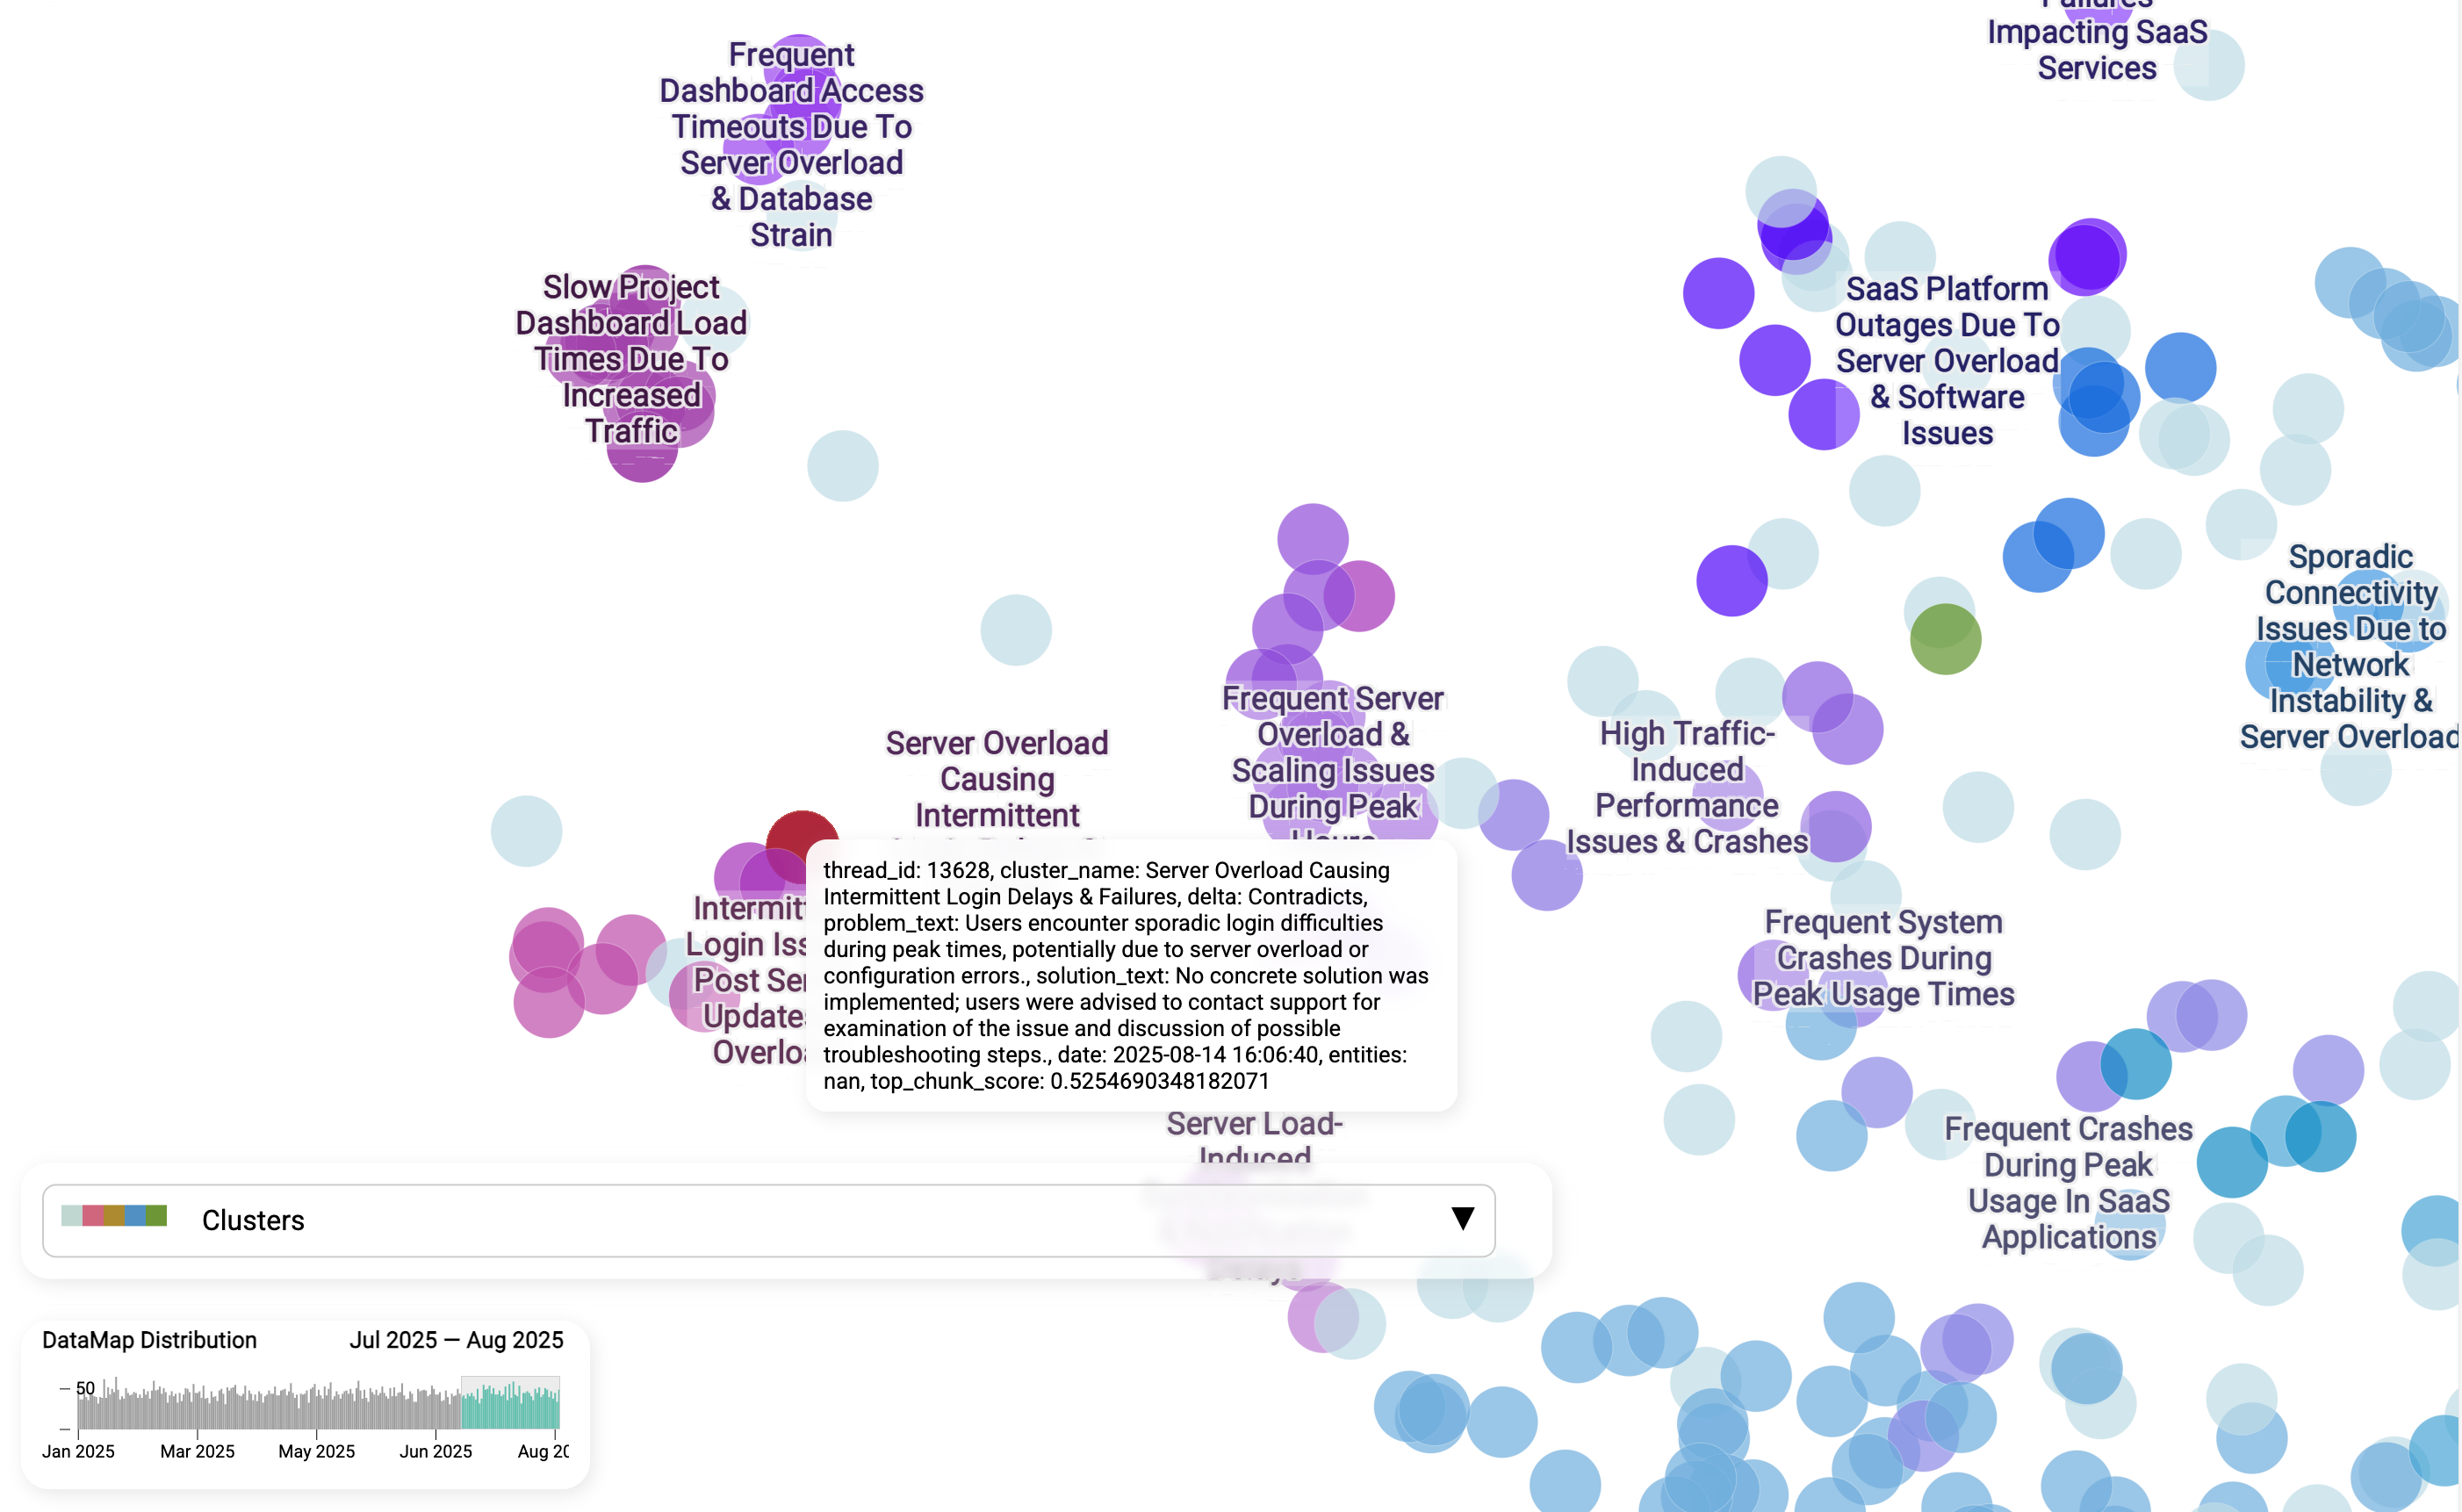
Beyond the clusters and labels, we can also zoom into individual tickets to hear customers in their own words. Each snippet shows how people actually describe the problem: "sporadic login difficulties during peak times," "slow project dashboard load," or "no concrete solution was implemented."
This matters because it gives teams a ground-level perspective that numbers alone ca not provide. Leaders can see the real customer experience, while support agents can mirror the same phrasing and context in their replies. That not only makes responses feel more empathetic and relevant, but also helps ensure that solutions are aligned with how users actually articulate their pain.
How it works
Step 1 - Turn messy conversations into tidy records.
We use an AI assistant to read each ticket thread and capture four fields: problem, solution, solution steps, and entities (e.g., product, version, region). The assistant double‑checks itself and retries when uncertain.
Step 2 - Group similar issues.
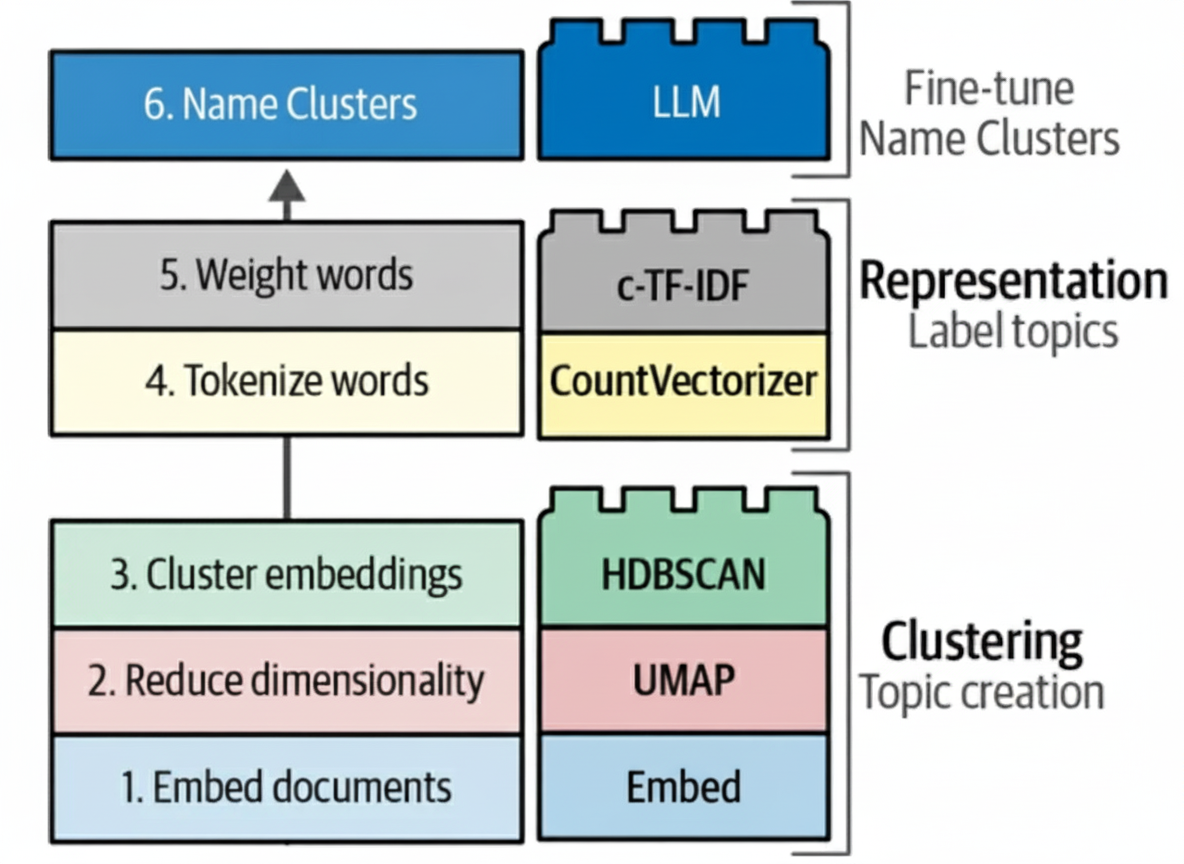
Each problem is turned into a numeric "meaning vector" (an embedding). Similar tickets sit near each other, so we can build clusters from broad themes down to specific sub‑issues. To achieve this we use Semantic Embeddings & Similarity Search, Hierarchical Clustering, Topic Modeling & Labeling.
Step 3 - Name, monitor, and act.
We attach short, human‑readable labels to clusters, build dashboards to spot spikes and trends, and link each cluster to a unified response and an owner. That closes the loop from insight to action. LLM-Powered Agents Use Cases: LLM agents handling new tickets get fed cluster context and representative solution records to better answer, triage, or escalate in real time - effectively grounding responses in prior knowledge and reducing hallucination.
From insight to action: LLM‑Based Agents closing the loop
Your team already owns the goldmine: past tickets and proven replies. When organised into clusters and themes, this "corporate memory" becomes the foundation for LLM-based agents - that can handle new issues more effectively.
- Grounding in real history. Instead of inventing answers, agents can pull from representative past cases - phrased the way customers actually talk and resolved the way experts actually solved them. This reduces hallucination risk and keeps responses aligned with company policies.
- Context-aware triage. By surfacing trending clusters, LLM agents can tailor their replies to the moment - explaining today's hot issue (e.g. login failures, billing changes) with more empathy and precision.
- Hierarchical reasoning. Frameworks like Chain-of-Agents or Data Interpreter map naturally onto the layered structure of support problems - broad categories at the top, specific root causes below - letting agents collaborate like human teams do.
- Smart context engineering. With limited context windows, not every ticket history fits. Aggregated cluster views let agents select only the most relevant examples and compressed summaries - maximizing accuracy while controlling cost.
In practice, this means LLM agents do not start from scratch. They stand on the shoulders of thousands of prior resolutions, turning past experience into faster answers, fewer escalations, and smarter decisions - closing the loop from messy inbox to automated resolution.
Summary
By turning messy inboxes into structured records, clusters, and clear visuals, support teams gain a high-resolution view of customer pain points. They can see what is trending, trace issues back to their root causes, and coordinate unified responses. When paired with LLM-based assistants, these insights close the loop - delivering faster replies, fewer escalations, and a healthier backlog.